Answering Science MCQs That Use Diagrams

Answering science MCQs that use diagrams needs a different skill from answering text-only questions, because the information you need is drawn, not written. Many students look at the options first and then glance at the diagram, which leads them to pick an option that sounds familiar instead of one that matches the picture. The correct method is the reverse: study the diagram fully before you read the options, so you already know what the diagram shows. Diagrams in Sindh board science papers may show apparatus, life cycles, circuits, graphs, or body parts, and each type has labels, axes, or scales that carry the answer. This guide teaches you a step-by-step way to read any science diagram, avoid common misreading traps, and use diagrams together with elimination for a confident answer.
Start With the Diagram, Not the Options
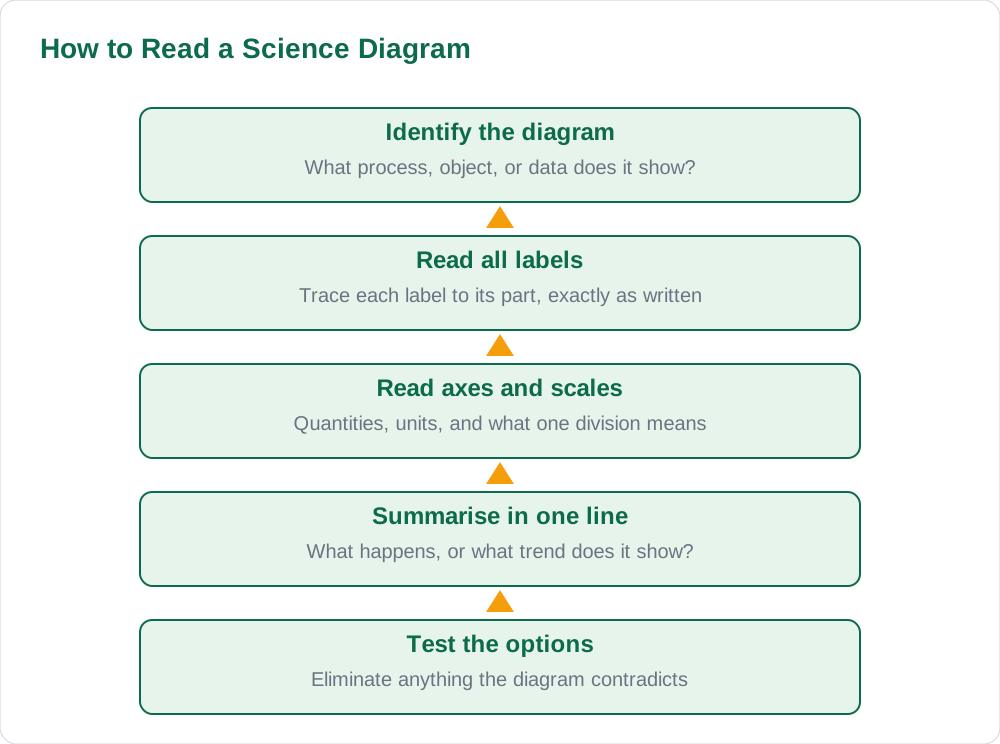
When a question includes a diagram, cover the options and spend twenty to thirty seconds studying the picture alone. Ask yourself what the diagram is showing, what its main parts are, and what is changing or happening in it. Read every label, even the small ones, because test setters often hide the key detail in a label students skip. If the diagram is a graph, read the title and both axes before looking at any plotted line or bar. If it is a labelled drawing, trace each label to its part and say what that part does. This short study period gives you an independent understanding, so the options cannot mislead you.
Students who skip this step often fall for options that describe a similar but different diagram from the same chapter. For example, a student who half-remembers a diagram of one process may accept an option describing a related process, because both feel familiar. Studying the actual diagram first prevents that confusion, since you compare each option against what is drawn in front of you, not against a vague memory. If the diagram confuses you at first, look for the most familiar part and work outward from it, naming each part as you go. Even a partial understanding narrows the options considerably. Practise with textbook diagrams on the books page.
Reading Labels, Axes, and Scales Correctly
Labels are the diagram's vocabulary, so read them exactly, including units and abbreviations. A label saying centimetres is not the same as one saying metres, and a part labelled with a similar name to another part may do a completely different job. When two labels look alike, slow down and check each letter, because science uses many near-identical terms. Axes on graphs need the same care: check what quantity each axis measures, what unit it uses, and what each division stands for. A graph that rises steeply may actually show a small change if the scale is large, and a flat-looking line may hide a big change on a fine scale.
Scales trip up even strong students, especially when axes do not start at zero or use uneven steps. Always check the first and last numbers on each axis and count what one small division represents before judging any trend. On bar charts, compare bar heights against the axis, not against each other by eye alone, since a truncated axis exaggerates differences. On line graphs, note whether the line is straight, curved, rising, falling, or flat in each section, and match each section to the process being described. Writing a one-line summary of the diagram, such as the value rises then stays constant, gives you a clear fact to test the options against. See Using Estimation to Narrow MCQ Options in Math for number sense.
Matching the Diagram to the Options
Once you understand the diagram, read each option and ask whether it matches what the diagram actually shows. Eliminate options that describe something absent from the diagram, contradict a label, or reverse a trend shown on a graph. This is where the elimination technique shines, because diagram questions often include one option that contradicts the picture plainly once you have studied it. Do not let an option that states a true science fact pass this test unless it also matches the diagram; the question asks about this diagram, not about the chapter in general, and a true-but-irrelevant option is still wrong.
Pay special attention to options that mention only part of the diagram. A question may ask about the whole process shown, while an option describes only the first step, or it may ask about one labelled part while an option describes a different part. Check the stem again to be sure which part or stage the question targets, then judge each option against that target only. If two options both seem to match the diagram, compare them closely: one may add an extra claim that the diagram does not support, and that extra claim is what makes it wrong. Diagrams reward precise matching, so never accept an option that goes even slightly beyond the evidence drawn. More strategies are on the blog.
Common Diagram Traps to Avoid
One common trap is the swapped label, where two parts look similar and their labels are easy to mix up, especially in biology drawings of organs or plant parts. Another trap is the misleading scale, where a graph's shape looks dramatic only because the axis is stretched, or looks flat only because the axis is compressed. A third trap is the extra detail: diagrams often include parts or data that are not needed for the question, and students who try to use every detail get confused. Learn to ignore irrelevant detail once you know what the stem asks, and focus only on the parts that matter for that question.
Apparatus diagrams carry their own traps, such as a delivery tube drawn into the wrong liquid or a thermometer placed incorrectly, and the question may ask what is wrong with the setup. In such questions, check each piece of apparatus against how the experiment should work, rather than assuming the drawing is correct. Circuit diagrams similarly reward checking each connection and component symbol carefully. Whenever a diagram looks slightly odd, trust your eyes: the odd detail is often the point of the question. Note it, summarise it, and then test the options against it instead of dismissing it as a drawing quirk. The solved notes include diagram-based revision material.
Practising Diagram Questions Every Day
Diagram skill improves fastest when you practise with real textbook diagrams rather than only reading about them. Open your science book, cover the text, and try to explain each diagram aloud: what it shows, what each label means, and what question an examiner might ask about it. Then uncover the text and check yourself. This exercise builds the habit of reading diagrams independently, and it doubles as revision, since explaining a diagram forces you to recall the whole concept behind it. Do two or three diagrams a day and your speed will grow noticeably within a few weeks.
When you attempt practice papers, treat diagram questions as a separate category in your error log. Note whether each mistake came from misreading a label, misreading a scale, or matching the wrong part, and you will quickly see your personal pattern. Many students discover that almost all their diagram mistakes come from one cause, such as ignoring units, and fixing that one habit lifts their whole diagram score. In the exam, give diagram questions their full thirty seconds of study time even when you feel rushed, because a rushed glance is the main cause of diagram errors. Read Keeping an MCQ Error Log for Repeated Mistakes to track this.
AI Help: Muse AI
Muse AI is Meta's personal AI assistant, and it can help you practise science diagram questions. For example, you can ask it to explain what each label in a textbook diagram means, or to describe how to read a graph's axes and scales step by step.
Join Muse with invite code LTGSWD — in the Muse app, go to Settings > Redeem token and enter the code.
Disclosure: LTGSWD is the author's Muse invite code.
Muse AI does not give official STBB answers — always verify against your Sindh Textbook Board book and your teacher.
5 key points you must know
- Study the diagram fully before reading the options, so options cannot steer your thinking.
- Read every label exactly, including units, abbreviations, and similar-looking terms.
- Check graph axes, starting values, and what one division represents before judging trends.
- Eliminate options that contradict the diagram, even if they state true science facts.
- Practise by explaining textbook diagrams aloud with the text covered.
Frequently asked questions
What if I cannot understand the diagram at all?
Start with the most familiar part and name it, then work outward to neighbouring parts. Read the stem again, since it often tells you which part or trend matters. Even a partial reading lets you eliminate some options, and you can return to the question later.
Should I read the options first to know what to look for in the diagram?
No, because options can plant a wrong idea that makes you misread the diagram. Study the diagram first and form your own summary, then use the options only to test that summary. This order protects you from attractive distractors.
Why do graph questions trick so many students?
Because students judge the shape of a line without checking the scale. A steep line on a large scale may show a small change, and a flat line on a fine scale may hide a large one. Always read the axes and divisions before describing any trend.
How much time should a diagram question take?
Allow about thirty seconds to study the diagram and another thirty to test the options. That minute is well spent, since a rushed glance causes most diagram mistakes. Mark the question and return later if it still resists after a careful reading.
Solved notes — preview free
These guides work best with the solved exercises. Preview the solved notes free on this website — 119 solved notes for Classes 6–10 in Sindhi, Urdu, English and Arabic medium. Or browse the full solved notes catalogue for your class and medium. New solved notes are added regularly — check the catalogue for coming-soon books.