Tracking Study Progress with a Simple Chart

A progress chart is a one-page record that shows, at a glance, which chapters are finished, which are partly done, and which still feel weak. Without a chart, pupils rely on memory and feeling to judge progress, which is unreliable: a chapter read once can feel finished while its questions remain unpractised, and a weak topic can hide for weeks until a test exposes it. With a chart, progress becomes visible, motivation grows from crossed-off boxes, and revision choices become obvious rather than guessed. This guide shows how to build a simple chart for school pupils in Sindh, how to update it honestly, and how to use it to plan each week. It tracks your own study, not any official record.
What belongs on a one-page progress chart
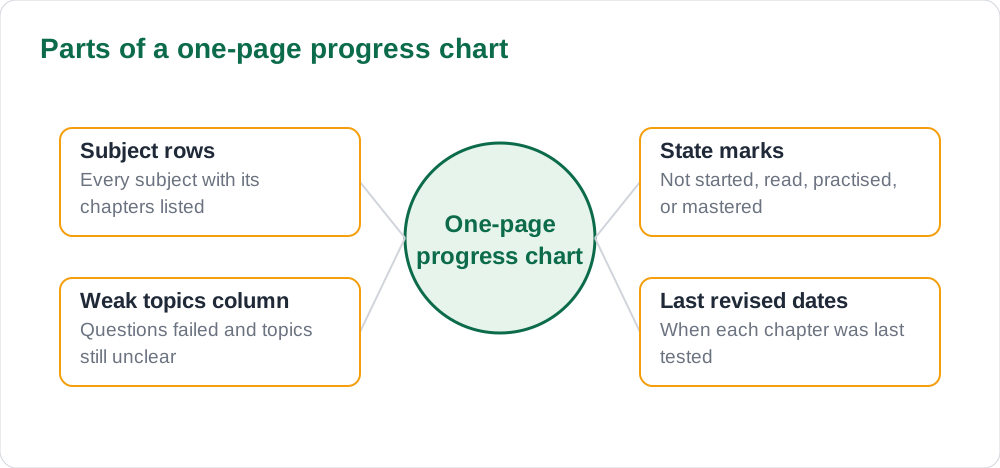
A useful chart lists every subject down one side and its chapters or topics across the top, or in a simple list if the subject has many chapters. Each cell or row gets a mark that shows its state: not started, read, practised, or mastered, using colours, symbols, or short words that you can read quickly. Keep the chart to one page per subject or one page for all subjects with brief topic names, because a chart that sprawls across many pages will not be checked daily.
Add a small column for weak topics and questions you got wrong, since that column drives future revision. Also add the date each chapter was last revised, because a chapter mastered a month ago may need a refresh before a test. The chart should take less than five minutes to update after a study session; if updating feels like a chore, simplify it. A chart with three clear states beats a complex system with ten states that nobody maintains.
Marking honestly: read is not the same as mastered
The most important honesty rule for a progress chart is that reading a chapter is not mastering it. Mark a chapter as read when you have studied it, as practised when you have answered questions on it, and as mastered only when you can answer questions or explain it without the book open. Pupils who mark everything as done after one reading create a chart that lies, and then feel betrayed when tests reveal the gaps the chart hid.
Self-testing is the honest check for the mastered mark. After studying a chapter, close the book and answer three questions or explain the main idea aloud; if you succeed, the mastered mark is earned. If you fail, the chapter stays at practised, and the failed questions go into the weak-topics column for the next revision. This discipline feels slower at first, but it produces a chart you can trust, and a trusted chart makes every later planning decision easier. For practice questions to test yourself with, see solved notes.
Updating the chart as a daily and weekly habit
Update the chart immediately after each study session, while the result is fresh, rather than saving updates for the weekend. A thirty-second update, marking one chapter from practised to mastered, keeps the chart accurate with almost no effort. Weekend updates then become a review rather than a reconstruction: look across the chart, count mastered chapters, spot subjects with many unstarted topics, and choose next week's revision targets from the weak-topics column.
Keep the chart where you study, on the wall or as the first page of a study folder, so updating it becomes part of finishing study rather than a separate task. If you use a digital chart, keep it equally simple: one page, three states, and a weak-topics list. The format matters far less than the habit. Pupils who update daily for a month usually find the chart becomes motivating in itself, because visible progress across a term is genuinely satisfying to look at.
Using the chart to plan revision and catch problems early
A chart earns its keep when it changes planning decisions. Before a test, revise mastered chapters lightly and practised chapters thoroughly, rather than treating all chapters equally. During a term, a subject with many unstarted chapters by mid-term is an early warning that needs action, such as extra slots or teacher help, long before it becomes a crisis. The chart turns vague worry into specific information: which chapters, in which subjects, and how far behind.
The chart also helps conversations with teachers and parents. Showing a teacher your weak-topics column lets them target their help precisely, instead of guessing where you struggle. Showing a parent the mastered count demonstrates real effort far better than saying you studied. When progress stalls in a subject, the chart shows whether the cause is lack of time, lack of practice, or difficulty with specific topics, and each cause has a different fix. That clarity is the real value of tracking.
Keeping the chart motivating instead of discouraging
A chart can discourage if it only shows how much remains, so design it to show progress too. Count mastered chapters weekly and celebrate milestones, such as finishing a subject's first half or mastering a previously weak topic. Colour the mastered cells brightly so the eye sees achievement first, and keep unstarted cells neutral rather than alarming. Progress is the story the chart should tell, even when much work remains.
If the chart starts to feel like a judgment, simplify it: fewer states, fewer details, and a focus on this week's targets rather than the whole term. Take a photograph of the chart each month to see how far it has come, because daily views hide long-term progress. And if a subject's chart stays empty for weeks despite effort, treat that as information, not failure: it may signal a need for teaching help, a different study method, or a conversation with your teacher. A chart is a tool for learning, and like any tool, it should serve you, not shame you. Check books for the chapter lists your chart should track, and the blog for more study tracking ideas.
AI Help: Muse AI
Muse AI is Meta's personal AI assistant. You can ask it to explain a concept in simple words, summarise a lesson, or make practice questions for revision.
For this topic, ask Muse AI to make a short self-test for a chapter marked practised, so you can honestly decide whether it deserves the mastered mark.
Join Muse with invite code LTGSWD — in the Muse app, go to Settings > Redeem token and enter the code.
Disclosure: LTGSWD is the author's Muse invite code.
Muse AI does not give official STBB answers — always verify against your Sindh Textbook Board book and your teacher.
5 key points you must know
- A progress chart lists subjects and chapters with clear states: read, practised, or mastered.
- Mastered means you can answer questions or explain the topic with the book closed.
- Update the chart for thirty seconds after each session, and review it weekly.
- Use the weak-topics column to choose revision targets and to ask teachers precise questions.
- Design the chart to show progress and milestones, not just remaining work.
Frequently asked questions
Should I track every subject on one chart or one chart per subject?
Either works if it stays on one page per view. A single-page overview suits pupils with few subjects, while one page per subject suits pupils with many chapters. Choose the format you will actually update daily, and keep the weak-topics column in both formats.
How often should I update my progress chart?
Update it briefly after each study session, and review it properly once a week. Daily updates keep it accurate with minimal effort, while weekly reviews turn the chart into planning decisions. Saving all updates for the weekend usually means forgetting details and abandoning the chart.
What if a chapter I marked mastered feels weak again later?
Move it back to practised without hesitation. Memory fades, and honest downgrades keep the chart trustworthy. Re-revise the chapter, test yourself again, and restore the mastered mark when you earn it. A chart that allows downgrades is far more useful than one that only moves forward.
Can a progress chart help before exams?
Yes, greatly. Before exams, use the chart to prioritise: light review for mastered chapters, thorough practice for practised ones, and focused learning for unstarted essentials. The chart prevents the common exam mistake of revising strong chapters repeatedly while weak ones stay untouched.
Is a paper chart or a digital chart better?
Paper charts on the study wall are visible every day and easy to update, which suits most pupils. Digital charts suit pupils who always carry a device and prefer typed lists. The better chart is the one you update daily; format is secondary to the habit.
Solved notes — preview free
These guides work best with the solved exercises. Preview the solved notes free on this website — 119 solved notes for Classes 6–10 in Sindhi, Urdu, English and Arabic medium. Or browse the full solved notes catalogue for your class and medium. New solved notes are added regularly — check the catalogue for coming-soon books.